
Every minute, your heart pumps the equivalent of about five litres of blood around the body, enough to circulate your whole blood volume roughly once a minute at rest. That quantity is called cardiac output, and it is one of the most useful numbers in physiology and critical care, because it tells you whether the body’s tissues are getting enough blood and oxygen. This guide explains the cardiac output formula, what makes up stroke volume, how to turn cardiac output into cardiac index, how it is measured, and how to read the numbers, with eight worked examples and original tables.

Table of Contents
- What cardiac output means
- The cardiac output formula
- Normal values
- What controls stroke volume
- Heart rate and stroke volume together
- Cardiac index
- Oxygen delivery
- How cardiac output is measured
- Cardiac output, resistance and blood pressure
- Eight worked examples
- Signs of low cardiac output
- Limitations
- Common mistakes
- Tips for students and nurses
- Frequently asked questions
- Key takeaways
1. What Cardiac Output Means
Cardiac output (CO) is the volume of blood the heart pumps out of one ventricle in one minute. It is written in litres per minute (L/min). The body’s needs change from moment to moment, so cardiac output changes too: it rises during exercise, fever or stress, and falls during rest, blood loss or heart failure. As the StatPearls review of cardiac output explains, changes in cardiac output closely follow changes in the body’s oxygen needs.
2. The Cardiac Output Formula
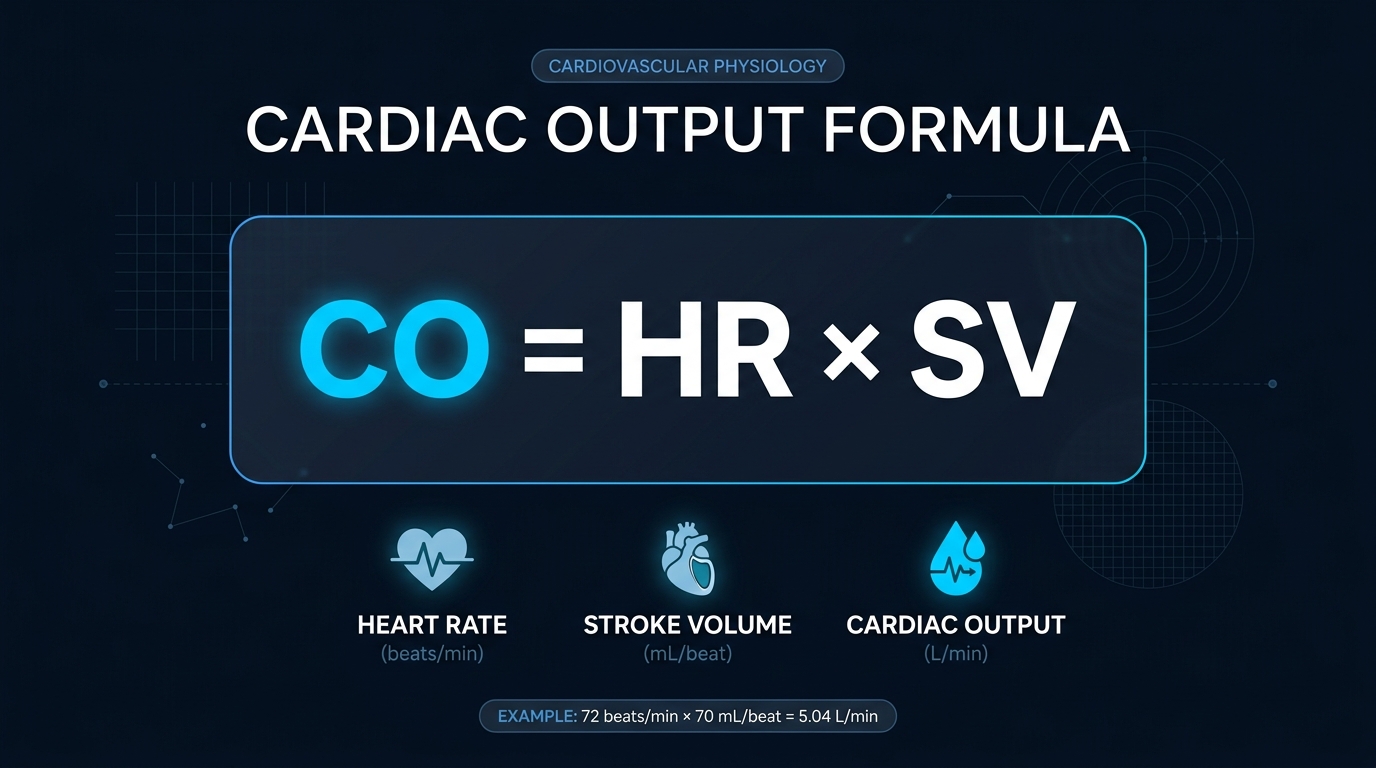
CO = HR × SV| Term | Meaning | Unit |
|---|---|---|
| CO | Cardiac output | mL/min or L/min |
| HR | Heart rate | beats per minute |
| SV | Stroke volume, the blood ejected per beat | mL per beat |
Stroke volume itself comes from the difference between the volume of the ventricle just before it squeezes (end-diastolic volume, EDV) and just after (end-systolic volume, ESV):
SV = EDV − ESV
Ejection fraction (EF) = SV / EDV × 100
Unit tip: HR × SV gives mL per minute. Divide by 1,000 to get litres per minute.
3. Normal Values
| Measure | Typical adult range |
|---|---|
| Cardiac output at rest | 4 to 8 L/min (average about 5 L/min) |
| Heart rate at rest | 60 to 100 beats per minute |
| Stroke volume | About 60 to 100 mL per beat (some sources 50 to 100) |
| Ejection fraction | About 55% to 70% |
| Cardiac index | 2.5 to 4.0 L/min/m² |
| Systemic vascular resistance | 800 to 1,200 dynes·sec/cm⁵ |
Reference ranges differ slightly between textbooks and laboratories, and a summary table of typical haemodynamic values is shown in this table of normal values. During hard exercise, cardiac output can rise several-fold, and in elite athletes it can reach roughly 40 L/min.
4. What Controls Stroke Volume
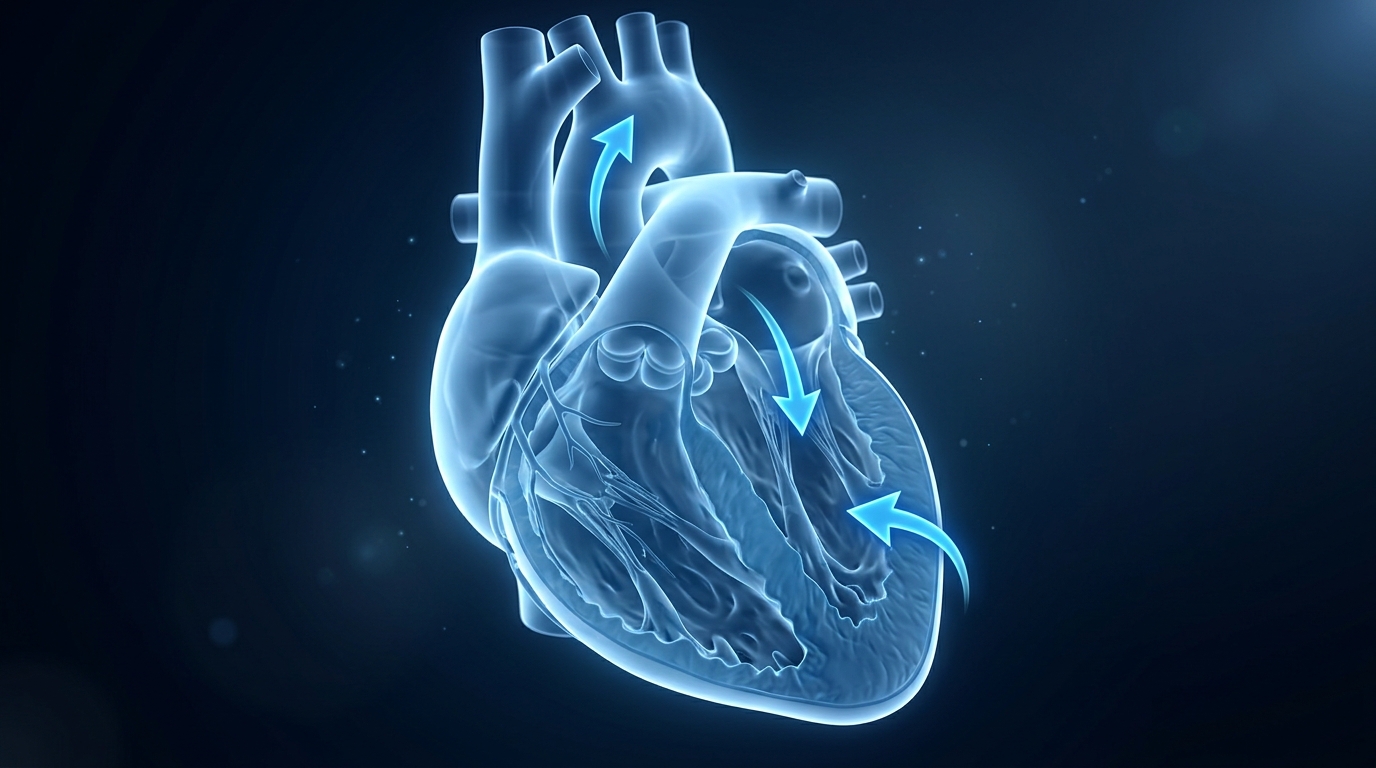
Stroke volume depends on three factors, remembered by the mnemonic SV CAP: Contractility, Afterload and Preload.
| Factor | Meaning | Effect on stroke volume |
|---|---|---|
| Preload | How full the ventricle is before it contracts (end-diastolic volume) | More preload raises SV, up to a point (Frank-Starling law) |
| Afterload | The resistance the ventricle must pump against (aortic pressure, vascular resistance) | More afterload lowers SV |
| Contractility | The force of the heart muscle contraction, independent of loading | More contractility raises SV |
Frank-Starling law in one sentence: the more the heart muscle is stretched by incoming blood, the harder it contracts, so a fuller ventricle usually ejects more.
Examples of what changes each factor:
- Preload falls with bleeding, dehydration or vasodilation, and rises with fluid loading.
- Afterload rises with high blood pressure, aortic stenosis or vasoconstriction.
- Contractility rises with adrenaline and certain drugs (inotropes) and falls in heart failure or after a heart attack.
5. Heart Rate and Stroke Volume Together
This original table lets you read cardiac output (in L/min) from any heart rate and stroke volume without a calculator.
| HR (beats/min) | SV 50 mL | SV 60 mL | SV 70 mL | SV 80 mL | SV 100 mL |
|---|---|---|---|---|---|
| 50 | 2.5 | 3.0 | 3.5 | 4.0 | 5.0 |
| 60 | 3.0 | 3.6 | 4.2 | 4.8 | 6.0 |
| 70 | 3.5 | 4.2 | 4.9 | 5.6 | 7.0 |
| 80 | 4.0 | 4.8 | 5.6 | 6.4 | 8.0 |
| 100 | 5.0 | 6.0 | 7.0 | 8.0 | 10.0 |
| 120 | 6.0 | 7.2 | 8.4 | 9.6 | 12.0 |
| 150 | 7.5 | 9.0 | 10.5 | 12.0 | 15.0 |
A caution about speed: a faster heart does not always mean more output. When the heart rate gets very high, the ventricle has too little time to fill, so stroke volume falls and cardiac output can drop (see Example 5).
6. Cardiac Index
Cardiac output depends partly on body size, so a 50 kg woman and a 110 kg man are hard to compare. The cardiac index (CI) fixes this by dividing by body surface area (BSA):
CI = CO / BSA (L/min/m²)The normal range is 2.5 to 4.0 L/min/m². A cardiac index below about 2.2 is often used as a marker of low output. For how to calculate BSA, see our guide to the body surface area formula.
Original table: the same cardiac output of 5 L/min in different body sizes
| BSA (m²) | Cardiac index (L/min/m²) | Interpretation |
|---|---|---|
| 1.5 | 3.33 | Normal |
| 1.7 | 2.94 | Normal |
| 1.9 | 2.63 | Normal, towards the low end |
| 2.1 | 2.38 | Slightly low |
| 2.3 | 2.17 | Low |
The same 5 L/min is comfortable for a small person but borderline for a large one, which is why the index is the more meaningful number.
7. Oxygen Delivery
Cardiac output matters because it carries oxygen. The oxygen delivered to the tissues each minute is:
DO₂ (mL/min) = CO (L/min) × arterial oxygen content (mL/dL) × 10
Arterial oxygen content ≈ 1.34 × hemoglobin (g/dL) × SaO₂
Example: hemoglobin 14 g/dL, saturation 98%, cardiac output 5 L/min.
Oxygen content = 1.34 × 14 × 0.98 = 18.4 mL/dL.
DO₂ = 18.4 × 5 × 10 = about 920 mL/min.
This shows that oxygen delivery has three levers: cardiac output, hemoglobin and saturation. For how saturation is measured and read, see our guide to normal oxygen saturation.
8. How Cardiac Output Is Measured
| Method | How it works | Notes |
|---|---|---|
| Fick principle | CO = oxygen consumption ÷ (arterial minus mixed venous oxygen content) | Considered a reference method when oxygen consumption is measured directly |
| Thermodilution | Cold fluid is injected through a pulmonary artery catheter and the temperature change is recorded | The most common bedside method in intensive care |
| Echocardiography | Ultrasound measures ventricular size and flow | Non-invasive, useful at the bedside |
| Pulse-contour devices | Analyse the arterial pressure waveform | Less invasive, need calibration |
| Estimation (HR × SV) | Uses measured heart rate and stroke volume | Accuracy depends on the SV measurement |
The Fick principle is a form of conservation of mass: the oxygen taken up by the lungs equals flow multiplied by the oxygen difference across the lungs. The caveats, such as assumptions about oxygen consumption and shunts, are explained in this Deranged Physiology chapter on Fick’s principle. A clear summary of the cardiac output equation and typical values is also available in this Lecturio cheat sheet.

9. Cardiac Output, Resistance and Blood Pressure
Blood pressure depends on how much blood the heart pumps and how much the vessels resist it.
MAP − CVP = CO × SVR          (SVR in Wood units)
SVR (dynes·sec/cm⁵) = 80 × (MAP − CVP) / CO
One Wood unit equals 80 dynes·sec/cm⁵. In plain words: pressure = flow × resistance.
This leads to an important point: a normal blood pressure can hide low cardiac output. If the vessels constrict, pressure may stay near normal even when flow is poor, which is why cool, pale skin and low urine output are important warning signs.
10. Eight Worked Examples
Example 1: Typical healthy adult.
HR 72, SV 70 mL.
CO = 72 × 70 = 5,040 mL/min = 5.04 L/min.
Example 2: Cardiac index.
CO 4.5 L/min, BSA 1.9 m².
CI = 4.5 / 1.9 = 2.4 L/min/m², slightly below the usual 2.5, so this needs interpretation in context.
Example 3: Stroke volume and ejection fraction.
EDV 120 mL, ESV 50 mL.
SV = 120 − 50 = 70 mL. EF = 70 / 120 = 58%, which is normal.
Example 4: Exercise.
HR 150, SV 100 mL.
CO = 150 × 100 = 15,000 mL/min = 15 L/min, three times the resting level.
Example 5: Faster is not always better.
At HR 100 with SV 70 mL: CO = 7.0 L/min.
At HR 190 with SV 30 mL (the heart cannot fill in time): CO = 5.7 L/min. The faster heart pumps less.
Example 6: Compensation after bleeding.
Before: HR 72, SV 70 mL, CO = 5.04 L/min.
After blood loss, SV falls to 40 mL and HR rises to 120: CO = 4.8 L/min. The heart rate rise keeps the output almost the same, which is why a fast pulse can be the first sign of bleeding.
Example 7: Fick method.
Oxygen consumption 250 mL/min, arterial oxygen content 20 mL/dL (200 mL/L), mixed venous oxygen content 15 mL/dL (150 mL/L).
CO = 250 / (200 − 150) = 5.0 L/min.
Example 8: Vascular resistance.
(a) MAP 90, CVP 5, CO 5: SVR = 80 × 85 / 5 = 1,360 dynes·sec/cm⁵, above 1,200, meaning the vessels are constricted.
(b) MAP 70, CVP 5, CO 8: SVR = 80 × 65 / 8 = 650 dynes·sec/cm⁵, below 800, meaning the vessels are dilated. The second pattern is typical of conditions such as sepsis, with high flow but low resistance.
11. Signs of Low Cardiac Output
- Cool, pale or clammy skin
- Weak, rapid pulse
- Low blood pressure (late), or a narrowing pulse pressure
- Reduced urine output, since the kidneys are very sensitive to blood flow (see our guide to normal urine output)
- Confusion or drowsiness
- Shortness of breath, swelling or fatigue in heart failure
- Rising lactate in blood tests

12. Limitations
- Normal values vary by size, age, fitness and lab.
- The formula needs a good stroke volume measurement, which is the hard part to obtain at the bedside.
- Heart rate and stroke volume change constantly, so a single reading is a snapshot.
- CO alone does not tell you the cause. Low output can come from low preload, weak contractility, high afterload or a rate problem.
- Measurement methods have their own errors, such as thermodilution in valve leaks and Fick with shunts.
- Blood pressure can be normal while cardiac output is low.
13. Common Mistakes
- Forgetting to convert mL/min to L/min.
- Using cardiac output where cardiac index is needed for patients of different sizes.
- Assuming a faster heart rate always raises output.
- Mixing up preload and afterload.
- Confusing stroke volume with ejection fraction.
- Treating a normal blood pressure as proof of normal flow.
- Using SVR units inconsistently (Wood units vs dynes).
14. Tips for Students and Nurses
- Learn “CO = HR × SV” and the memory aid “SV CAP” (Contractility, Afterload, Preload).
- Remember the ranges: CO 4 to 8, CI 2.5 to 4.0, SVR 800 to 1,200.
- For any patient, ask: is it the rate, the filling, the squeeze or the squeeze-against problem?
- Always read cardiac output together with blood pressure, urine output, skin and mental state.
- Report cool skin, a rising heart rate, low urine output or drowsiness early.
15. Frequently Asked Questions
What is the cardiac output formula?
Cardiac output = heart rate × stroke volume.
What is a normal cardiac output?
About 4 to 8 L/min at rest, with an average of about 5 L/min.
What is the cardiac index?
Cardiac output divided by body surface area. The normal range is 2.5 to 4.0 L/min/m².
What is stroke volume?
The volume of blood ejected by one ventricle with each beat, equal to end-diastolic volume minus end-systolic volume.
What are the three factors that affect stroke volume?
Preload, afterload and contractility.
What is the Frank-Starling law?
The heart contracts more forcefully when it is filled more, within limits, so stroke volume rises with preload.
How is cardiac output measured?
By the Fick principle, thermodilution, echocardiography or pulse-contour devices.
What is a normal ejection fraction?
About 55% to 70%. A value of 40% or less is called reduced ejection fraction.
What happens to cardiac output during exercise?
It rises, from around 5 L/min at rest to 15 L/min or more, and up to about 40 L/min in elite athletes.
What is systemic vascular resistance?
The resistance the heart pumps against, calculated as 80 × (MAP − CVP) / CO, with a normal range of 800 to 1,200 dynes·sec/cm⁵.
Cardiac Output Knowledge Quiz
Available options: 1 to 20
16. Key Takeaways
- Cardiac output = heart rate × stroke volume, normally 4 to 8 L/min.
- Stroke volume depends on preload, afterload and contractility (SV CAP).
- Cardiac index = CO ÷ BSA, normally 2.5 to 4.0 L/min/m², and it adjusts for body size.
- Oxygen delivery = cardiac output × arterial oxygen content × 10.
- Pressure = flow × resistance, so blood pressure can look normal while flow is low.
- Faster is not always better: very high heart rates can reduce stroke volume and output.
Disclaimer: This article is for educational purposes only and is not a substitute for professional medical advice. Haemodynamic measurements and treatment decisions must be made by qualified clinicians.
References
- StatPearls: Physiology, Cardiac Output. NCBI Bookshelf.
- StatPearls: Physiology, Cardiac Index.
- Fick A. Über die Messung des Blutquantums in den Herzventrikeln. 1870.